There is often a political wish or demand for new district heating (DH) systems to deliver (close to) 100% renewable heat from day 1. This is a very costly way forward, does not optimize the planned investments, and could result in higher heat prices than necessary. There may be a lack of knowledge about how little heat production capacity is needed to provide a substantial / important portion of renewable heat and how much money can be saved with a phased approach. This article takes a mathematical approach to this issue and works with real data from the city of Viborg in Denmark.
By Morten Jordt Duedahl, Business Development Manager, DBDH
Published in Hot Cool, edition no. 3/2025 | ISSN 0904 9681 |
The rush for renewable heat needs to be planned well and timed to succeed. DH is the only way for any urban area if 100% renewable heat is going to be a reality within the short timeframe available. At the same time, a good portion of patience and good planning will pay off significantly. Renewable heat sources that seem impossible to benefit from can become accessible, reducing the investment.
It is essential to deeply understand the relation between the requirements for renewable production capacity (measured in MW) and the renewable heat delivered (measured in MWh). In this article, the actual hourly production data from 2020 – 2022 from the Danish town Viborg will be analysed mathematically – the outcome is eye-opening.
The problem is that a rushed process will not allow the small steps forward to take advantage of the potential large heat sources available a bit further away. The classic example could be a waste incineration plant 8 km away, a large water treatment plant, etc.
The mathematical facts – not much is needed.
The mathematical fact based on production data from Viborg is that a little less than 20% (18,3%) of the installed production capacity can deliver 50% of the annual heat demand. 40% of the installed capacity can deliver 85% of the heat needed [1]. More relations between capacity and annual production are available in Figure 1.
| % renewable heat delivered | ||||
|---|---|---|---|---|
| Renewable capacity (%) | 2020 | 2021 | 2022 | Average |
| 0.0 | 0.0 | 0.0 | 0.0 | 0.0 |
| 10.0 | 31.2 | 27.5 | 31.3 | 29.9 |
| 11.2 | 34.8 | 30.7 | 34.9 | 33.3 |
| 18.3 | 52.5 | 46.1 | 52.0 | 50.0 |
| 20.0 | 56.2 | 49.4 | 55.6 | 53.5 |
| 25.0 | 66.0 | 58.5 | 64.6 | 62.8 |
| 30.0 | 74.8 | 67.0 | 71.9 | 71.0 |
| 32.7 | 79.0 | 71.1 | 75.5 | 75.0 |
| 40.0 | 88.8 | 80.6 | 84.6 | 84.5 |
| 50.0 | 97.6 | 90.2 | 94.5 | 93.9 |
| 60.0 | 99.9 | 96.2 | 98.9 | 98.2 |
| 64.2 | 100.0 | 97.7 | 99.5 | 99.0 |
| 68.9 | 100.0 | 98.8 | 99.8 | 99.5 |
| 70.0 | 100.0 | 99.0 | 99.8 | 99.6 |
| 80.0 | 100.0 | 99.8 | 100.0 | 99.9 |
| 90.0 | 100.0 | 100.0 | 100.0 | 100.0 |
| 100.0 | 100.0 | 100.0 | 100.0 | 100.0 |
Figure 1: The table shows calculations on the renewable heat produced (in % of total) in Viborg based of different renewable production capacities also in %. Some of the notable numbers are marked with a light green color. E.g. 50% renewable heat delivered are reached with 18.3% production capacity. 50% renewable capacity delivers 93.9% renewable heat. In 2020 100% renewable heat is reach at 64.2% capacity. For simplicity numbers are round of to one digit.
This fact should have enormous implications for investment decisions. It should also influence how policymakers orchestrate their incentive mechanisms.
Even if 80% of the production capacity is not renewable, the DH company can still deliver more than 50% renewable heat. An example: A project called “The 10MW heat pump network” indicates that a network with a 10MW heat pump will be built. If this project can start out by reducing the fossil impact by “only” 50% from day one, the required heat pump capacity will only be approximately 2MW.
There should, of course, be a requirement to demonstrate concrete and realistic plans on how to reach the politically decided goals and deadlines in time. The other 8 MW of renewable production capacity could then provide heat to 4 more networks – reducing the fossil impact by 50% for 5 times as many people – the pipe network needs to be built anyway and is not included here. The possible roads to 100% renewable heat will be discussed later in the article.
A lot of the production capacity is just standing doing nothing – most of the time.
A large part of the heat production capacity is hardly ever in use. The production capacity is just waiting until it gets very cold or if an unplanned service is needed at the main production source. In many places, this “idle” peak capacity is still based on oil and natural gas for good reasons.
Production capacity that is rarely needed (peak load) does not justify high investment costs. The fewer hours a production capacity is used per year, the lower the investment cost should be. The production cost of heat [2] from rarely used production capacity is of lesser importance, as the total share of heat delivered at a higher price is minimal. Low initial investments win over the higher heat production cost.
Figure 2: Duration curves for the city of Viborg from 2020 – 2022. Hourly production data
For base load, it is an entirely different story! Base load is meant to deliver the vast majority of heat demand. For base load, the focus should be finding production methods that give the lowest possible price. In contrast, the investment in capacity is of lesser concern – there are many more MWh on which to divide the fixed cost. Low heat production cost win against the higher investment cost.
Case Viborg
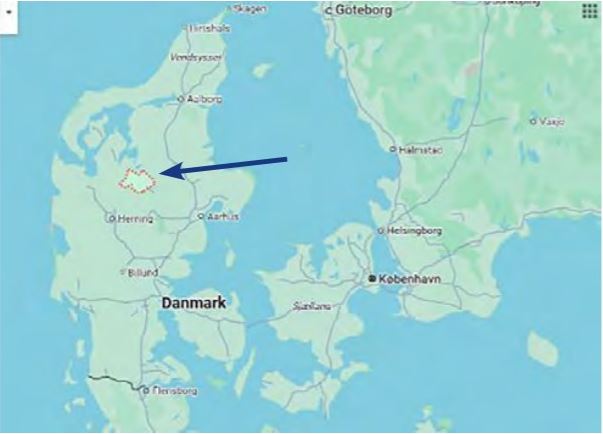
The article is based on data kindly shared by Viborg District Heating Company. The data set consists of hourly heat production data for 2020 – 2022. Viborg is a town in the western part of Denmark, with a widespread DH network servicing 12,500 buildings, covering around 70% of the heat demand, and requiring peak production capacity of 97.1 MW.
The heat consumption in Viborg is fully comparable to that in many other small and large towns and cities in Denmark and elsewhere. Viborg’s duration curve and heat consumption look like most duration curves in our temperature zone.
The data for this article is hourly production data from 1. January 2020 to 31. December 2022 – three full years illustrated in the duration curves seen in Figure 3. The expansion of the network in Viborg was neglectable during this period, meaning that data can be compared directly.
The weather differed a bit. 2021 had significantly colder days and seems to be a tad colder in general than the other years. Viborg’s peak demand is 97,1 MW (the highest production during the 3 years in the late winter of 2021).
Production and capacity overview in use in different years in Viborg:
| Year | Heat production (MWh) | Peak production (MWh) | Share of capacity not in use | Production from the 29% not in use 2020 (Hours/MWh/0%) |
|---|---|---|---|---|
| 2020 | 271.555 | 69,2 | 29% | 0 hours / 0 MWh / 0% |
| 2021 | 309.029 | 97,1 | 0% | 419 hours / 2.642 MWh/0.86% |
| 2022 | 271.196 | 89,4 | 8% | 81 hours/370 MWh/0.14% |
Table 1: In 2021, all production capacity was active simultaneously, resulting in the actual peak production in Viborg at 97.1 MW. In 2020, 29% of that production capacity was not in use. In 2022, 8% of the production capacity remained unused.
The 29% that stood still in 2020 was active 419 hours and produced less than 1% of the heat in 2021. In 2022, the numbers were 81 hours and 0.14%, representing a decrease from 29%. The 8% not in use in 2022 produced 24 MWh in 2020 (0,008% of the total production) and was active in 8 hours (not shown in the table).
An interesting fact evident in the dataset is that Viborg produced slightly more heat in 2020 than in 2022 (it was generally a bit colder – 355MWh colder), yet the coldest days in 2022 were significantly colder than in 2020.
35,8% of the production capacity delivers only 1% of the heat (Table 1) – i.e., it is hardly ever used!
One example of a less optimal investment decision could be to invest in a 3,58 MW heat pump (35,8% of 10 MW) that would only operate for 25 hours in Viborg in 2020, producing nearly no heat. That heat pump represents an enormous fixed cost. There are many other much less expensive options available.
How is the math done?
The calculation was performed using the full dataset, which contains 26,280 hourly heat production measurements. A formula calculates the amount of fossil fuel and renewable heat produced each hour at different renewable production capacity levels (in percentage). For example, if Viborg needs 42 MWh of heat in a specific hour and has a 30 MW renewable production capacity, the fossil part is 12 MWh. The numbers for each hour are summed up for each year, and the % of renewable and fossil production is calculated. If interested, the author can demonstrate the calculations.
Influence on investments and planning – an example
These calculations and facts should influence both the way DH is planned and how investments are prioritised. This article delivers an argument to consider the time horizon to carefully assess what the effect of installing too much renewable capacity too early could be. A timed approach is the right approach.
To illustrate this, the author created a fantasy city inspired by Viborg. It is called WeCastle (Viborg directly translates to WeCastle). In this fantasy city, a large part of the city will be heated by district heating in the future. At present, the local DH company is about to establish the first few phases with DH in the centre, and many more will follow in the coming years. Each phase will have a 10MW peak demand – around 10% of the real Viborg.
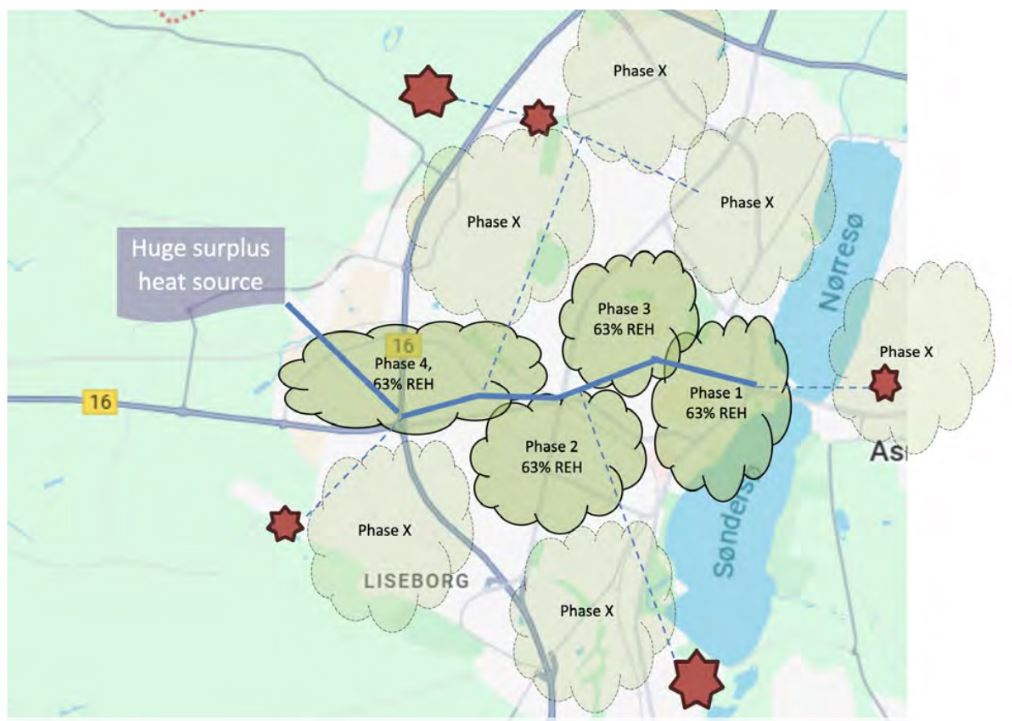
Figure 3: Illustration of how the different phases make it possible to reach a large surplus heat source. During the design and construction of each phase, the main pipe has been dimensioned to serve as a transmission pipe in the future. When the surplus heat source can be connected, the heat pumps in each of the phases are no longer base load, as cheaper heat from the surplus heat source can now be delivered to the existing 4 phases and also to the phases being built in the future.
The fantasy heat map of WeCastle reveals a substantial and stable renewable surplus heat source located just outside the city. Besides that, a few smaller surplus sources have been identified. The main surplus heat source entails all outstanding characteristics: a lot of surplus heat year-round, the cost of heat is only the cost of connecting to the heat network plus pumping cost, the heat comes at a temperature making it possible to use it directly in the network, etc. The heat itself is free of charge, as the surplus heat provider eliminates the costs of cooling the surplus heat away. This source is large, but each DH phase is small, so no individual phase of the planned DH project will find it viable to connect to the external heat source. This is not an unrealistic heat source example – consider a large waste incineration or an industrial production. Even less fantastic heat sources are relevant, e.g., a site for a very large heat pump benefitting from a better heat source than the small, often air-source heat pumps possible in city centers.
The key question for WeCastle DH Company is how to utilise this source – any other plan would mean wasting a lot of energy.
The unplanned WeCastle
Subsidy structures and misplaced, mistimed political requirements to transition from 100% fossil natural gas to 100% renewable heating from the start will force WeCastle to overinvest in every phase of its plan, leading to higher prices. They would need to invest in a 10 MW heat pump for each phase. WeCastle would also often become dependent on a single input factor (electricity for a heat pump) and have to accept poor energy efficiency. That has to be avoided.
Heat pumps are one of, if not the only, solution possible in most urban environments today. Such an investment will likely make it difficult for the project to stack up economically.
The planned WeCastle networks
The alternative to the unplanned approach is to include the time variable, which offers a better perspective. The only acceptable goal is still to become 100% renewable, but now, it is only within a longer timeframe. WeCastle should still take some substantial renewable steps forward from the beginning. In this example, reaching at least 50% renewable heat is the short-term goal! The well-planned WeCastle would build the same networks but now include a bit more than the required 18.3% – this article works with 25% renewable capacity – likely in the form of heat pumps. Using data from the real Viborg would give WeCastle the ability to deliver as much as 62,8% renewable heat to its citizens. The total investment cost would be significantly lower as the initial investment in renewable production capacity will be only 25%. WeCastle should be content with that for now and focus on getting more networks built!
The remaining capacity need could be covered by (existing) gas boilers which will cover 75% of the capacity. Existing gas boilers are easy to access, are often at a very low cost to re-connect to the network, and also give e.g. hospitals the redundancy they require. This solution builds trust in the network and lowers costs.
Figure 4: The green line indicates the 25% surplus heat. The area under the green line represents 63% of the heat demand. The area between the green and the blue line represents 31% of the heat demand.
With a well-accomplished project done, the DH company in WeCastle can continue to build the next pipe network again with only 25% renewable production capacity, [3] converting another neighbourhood to 62,8% renewable. And one more, and one more, and…
Heat planners in WeCastle are smart! They have planned the first phases to expand the heat networks in the direction of the large surplus heat provider – understanding the value of that heat. Therefore, they have designed the few main pipes much bigger than needed for each phase to make the pipes big enough for what is now going to happen – this is the first part of a future transmission system.
The strategically chosen phases are getting closer to the surplus heat provider step by step. They will eventually be able to connect all phases by adding the 4th phase to the network. And now, all the already built phases can benefit from the surplus heat provider.
In this mathematical example, the surplus heat provider can deliver 25% of the capacity demand. As long as only a part of the WeCastle network has been built, the share the surplus heat provider can deliver will be very high, maybe even 100%. That share will decrease as more phases are added and the surplus heat will be divided between more demand.
25%+25% approach
| 25%+25% | 2020 | 2021 | 2022 | Average |
| Surplus heat (25% capacity) | 66% | 59% | 65% | 63% |
| Heat pumps (25% capacity) | 32% | 31% | 829% | 31% |
| Total | 97% | 90% | 94% | 94% |
Table 2: When free surplus heat is introduced into the network, the heat produced by, e.g., heat pumps in the different zones, will be pushed upwards in the duration curve, as they have a positive cost. The free heat out-competed the more costly heat. The free heat will then cover 63% of the heat demand, and the heat pumps will top up with 31% ekstra.
To simplify the calculations for a fully built-out WeCastle network, the author assumes that each network has 25% renewable production capacity (heat pumps) and 25% comes from the surplus heat provider. The calculation from Viborg shows that this 25%+25% approach would provide the fully build out WeCastle network with 94% renewable heat delivered (see table 2), which also improves the energy efficiency of the total heat system (less heat wasted and less electricity used), and limits investments significantly. Also, notice that the 25% capacity covered by heat pumps moves up and is no longer base load, but middle-load – the heat pumps produce only 31,1% on average and not 62,8% (much fewer operation hours = less wear and tear = longer lifetime = longer depreciation time and less pressure on the power grid). With nearly no production cost from the surplus heat, the heat cost will also become less.
Even if there is no large surplus heat provider, the chance of building a larger production site on the outskirts of the town is likely and at a lower cost due to lower land cost, higher efficiency of larger production sites, and potentially better heat sources for heat pumps.
But there is still a need for 50% capacity to be built!!
Half the installed capacity must still be built to become 100% fossil-free. First, there will be a discussion of what 100% really is and then some proper solutions.
Two approaches
The first approach is clearly deceitful :-), but give it a thought for a few seconds.
1) Is 99.50001 = 100? If it is, there is only a need to install another 18,9% renewable capacity – ending at 68,9% renewable production capacity. The last 31% of production capacity produces less than 0.5% of the heat demand. In the case of Viborg, that is 1.400MWh per year!
2) Maybe less deceitful could be to claim that 99,95=100,0. In that case, the capacity need is 81,0% (less than 150MWh non-renewable heat pr. year on average.[4])
Heat planners and politicians would (and should) consider if adding the last 19% or 31% capacity should be the focus – especially if the focus could be redirected to the possibility of expanding the network further and converting yet another phase from 0.0% renewable heat to 93,9%. Even more, they should think about the cost of getting that production capacity.
The non-deceitful road to 100%
The road to 100% can be travelled in many ways. With all the easy and most effective stretches already done, the focus will be on more complex steps towards 100%. This could be smaller/more complicated surplus heat providers, establishing a more diverse heat production portfolio, e.g., adding electric boilers, taking advantage of the transmission system, and instead of small 25% in each phase heat pumps build larger heat pumps with better heat sources. This step-by-step and timed approach also allows new technologies to become available (technical or economic).
In 10, 20, or 25 years, other sources will exist and be available at an even lower cost. Working with the demand side to minimising peak demand (limiting the demand for peak production) is also a straightforward option. Adding much more storage is something that is already happening today. Digitalisation will enable a DH company to forecast head demand, electricity prices, etc., and more precisely, the invention of new price structures that limit peak demand. Biogas may become available and can be stored easily –the same for hydrogen- so existing gas boilers may just need a small adjustment to become renewable. Looking at Denmark today, the preferred solution is to aim at many solutions, especially solutions that react to different price signals.
Carbon capture is a new approach, and the first test plants are being built. Together with hydrogen production, carbon capture can demonstrate to be new attractive providers of surplus heat and, not least, drive out the last few grams of CO2. Is it acceptable to deduct captured carbon from the equation? Maybe!
In short, many roads are leading to Rome – each will move the system a few steps closer to the final goal and provide new options to keep prices low.
Conclusion
The conclusion is to go ahead at full blast but at a controlled speed with well-planned district heating projects. Ensure that DH’s characteristics are understood correctly, i.e., if it is better to provide very many with 94% renewable heat than very few with picture-perfect 100% renewable heat. Heat sources that seem impossible to reach for each phase may end up at your doorstep with good planning in a short time.
The time factor must be fully acknowledged – there is time, and it takes time. Rushing ahead may lead to bad decisions and, again, to higher prices than needed. Framework conditions, economy, and technology will continue to develop, and new opportunities will arise.
There is also a need for policymakers at all levels to accept that going from 0 to 100 is impossible or at least costly and ineffective, and they should incentivise accordingly. There are ways forward that provide significant results at a lower cost and in a much safer way, and they lead to the final goal.
For further information, please contact: Morten Jordt Duedahl at md@dbdh.dk
Foot notes
[1] The assumption in these calculations is that the renewable production capacity is capable of operating 24/7/365. That is not 100% realistic, but with a good combination of heat sources it is possible to get close to that number. The inclusion of storage will also make this more realistic. This article does not discuss how to combine different renewable sources in detail – this is a numbers game made on real numbers from Viborg. The need for back-up capacity is also not a part of this article.
[2] In this article the cost of heat is divided into two parts: One is the actual cost of the heat delivered – the MWh consumed. The other cost originating from the cost of investments in production capacity and network.
[3] 25% has been chosen for illustration and ease of calculation. As shown above the real number is 18,2% capacity to get 50% renewable heat delivered.
[4] The article does not include a discussion of the importance of having multiple heat sources that react to different price signals in the market. The most obvious price signal is electricity prices, which can benefit DH consumers when the price is high (with CHP) and low (with heat pumps and electric boilers).
“Duration curves and how they should influence the choice of heat production capacity” was published in Hot Cool, edition no. 3/2025. You can download the article here:
Did you find this article useful?
Subscribe to the HOT|COOL newsletters for free and get insightful articles on a variety of topics delivered to your inbox twice a month!